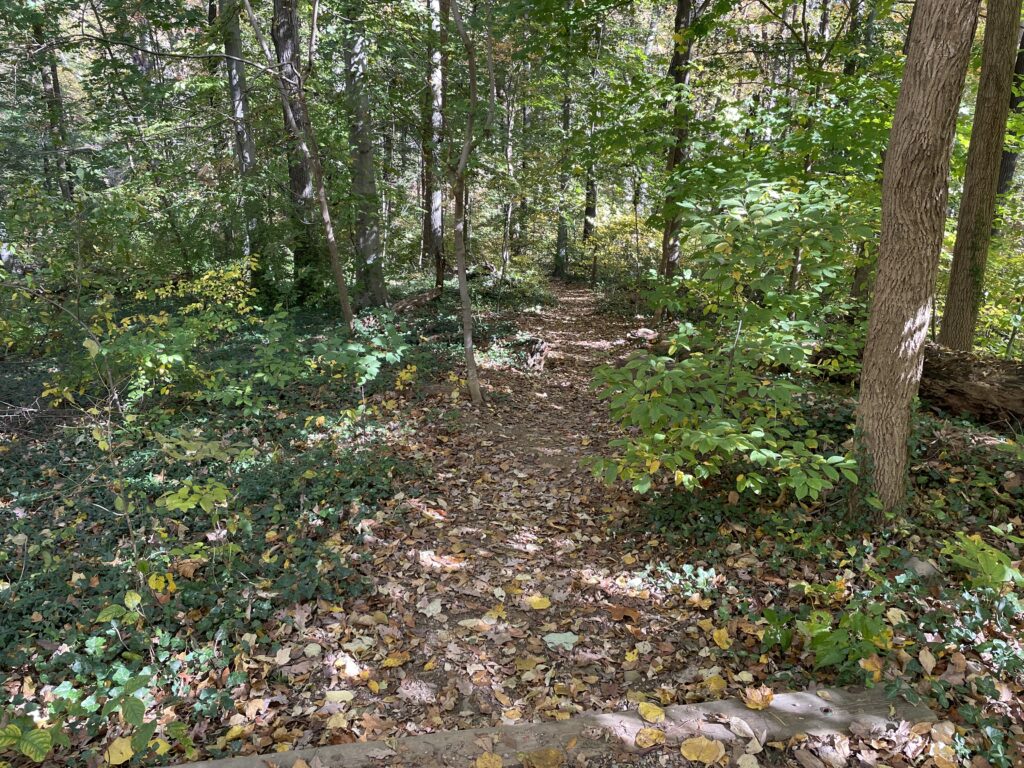
“Dear PoPville,
I wanted to share this map I made that shows common entry & exit points into Rock Creek Park. Read More
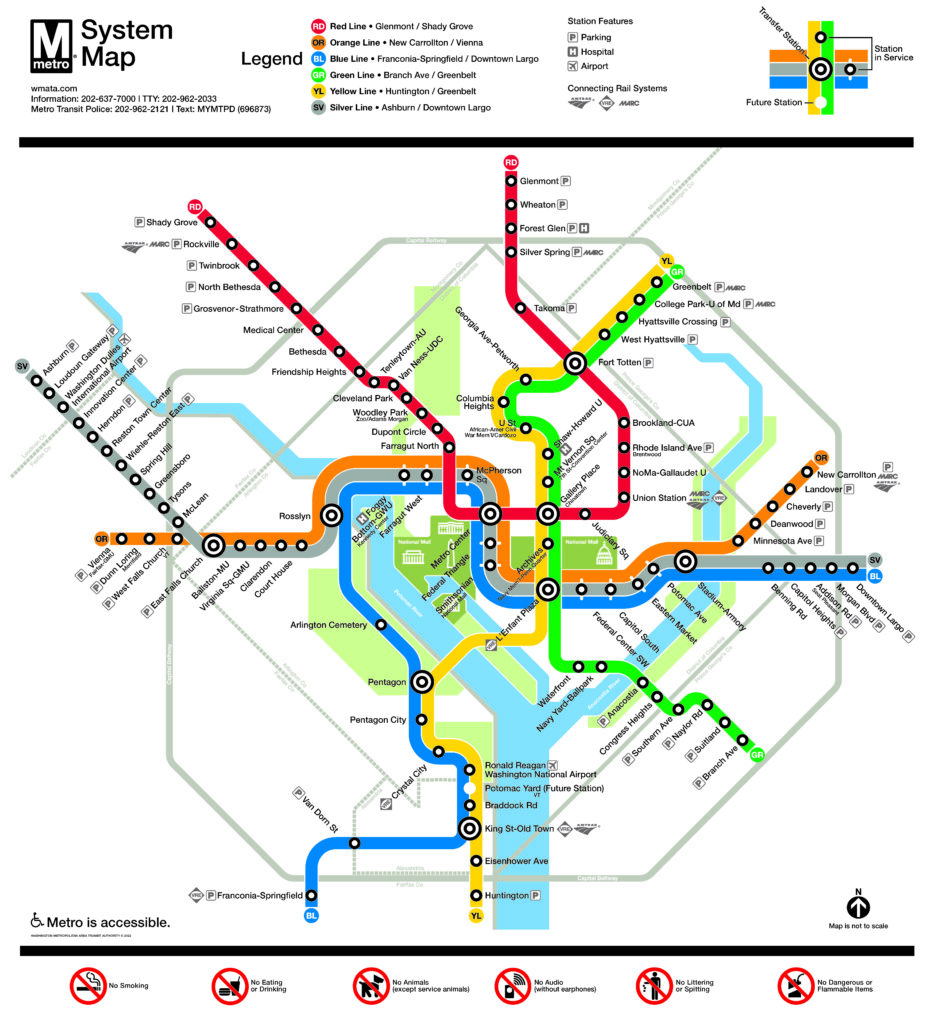
From WMATA:
“Metrorail’s iconic map is getting an update with the addition of the six new Silver Line stations. Beginning today, you’ll start to see new maps rolling out in stations, trains and transit centers, featuring Reston Town Center, Herndon, Innovation Center, Washington Dulles International Airport, Loudoun Gateway and Ashburn. Also on the new map, Potomac Yard Station is shown as a future station. Read More
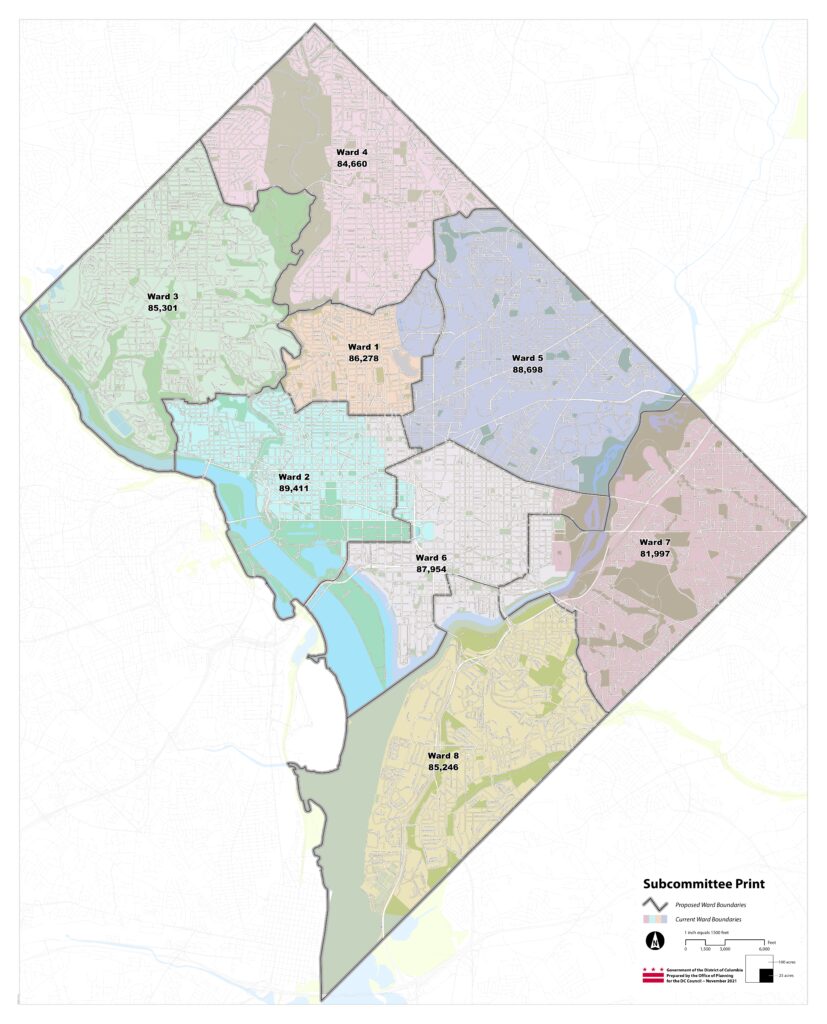
view map larger in PDF here: 2021-11-18 Final Subcommittee Map
More info from Councilmember Elisa Silverman:
“By law, every 10 years the District of Columbia needs to rebalance its population among the city’s electoral districts so all are roughly equal in size, within a legally permissible range. The District’s official Census count was 689,545, which means every ward must be between 81,883 and 90,503 residents. Currently, three wards fall outside of the mandated population boundaries: Wards 6, 7, and 8. Therefore, these three wards must be redrawn to ensure residents have equal representation in local government, and other wards may be impacted due to cascading effects and other considerations. Read More
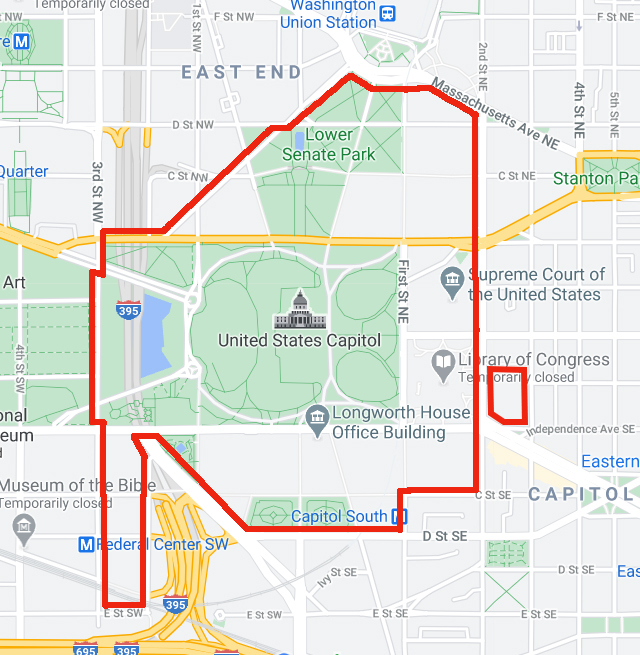
Ed. Note: A few folks have also sent me this Change.org petition against the fence.
Thanks to Claire for sending:
“I’ve seen lots of posts about the Capitol fence (here and elsewhere), but no one seems to be circulating a map of how far the fence actually extends. So yesterday I circumnavigated it and drew one. For scale, that’s more than three miles of fencing. Read More
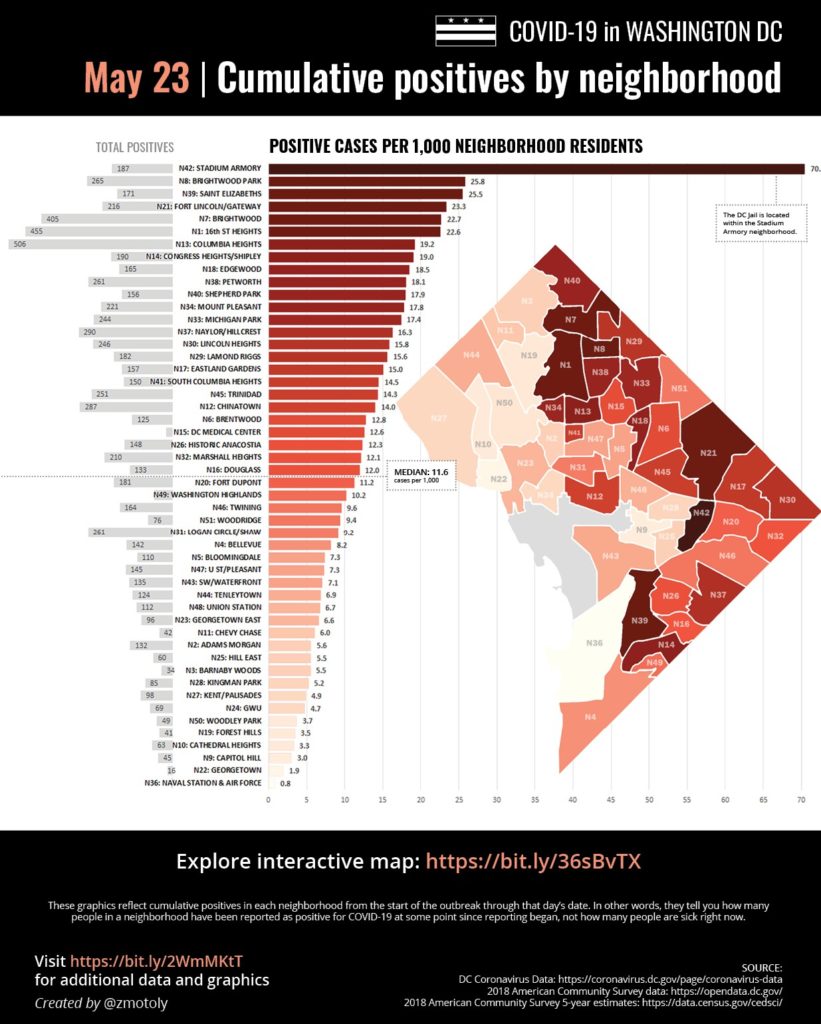
Ed. Note: Molly lives in Petworth. Molly is a hero for doing this. Huge thanks to Molly Tolzmann. Truly. You can explore the interactive map below.
State of the neighborhoods: This week’s big picture has not changed substantially. We see the same 5 neighborhoods as last week at each end of the spectrum, for most and fewest cases per 1,000 residents. Read More
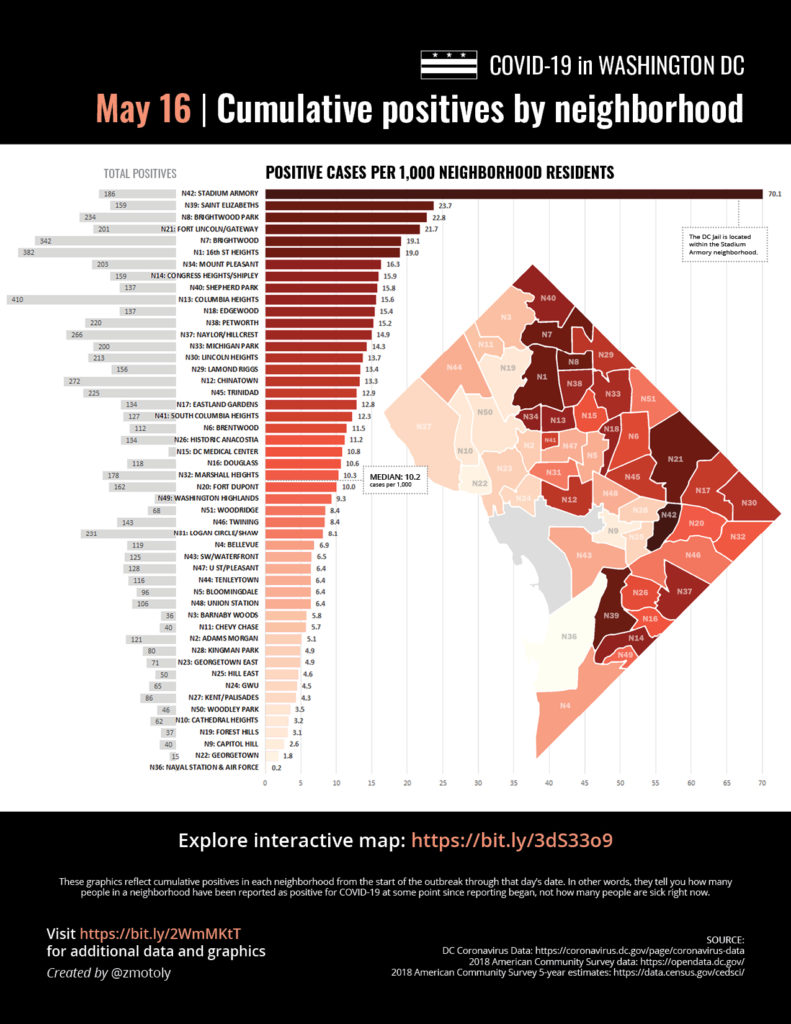
Ed. Note: Molly lives in Petworth. Molly is a hero for doing this. Huge thanks to Molly Tolzmann. Truly. You can explore the interactive map below.
I appreciate all of the comments and exchange sparked by last week’s look into DC’s per-capita COVID situation. Someone called me a ‘citizen analyst’ and I feel honored to hold that title, at least temporarily. So your citizen analyst is back with a few more insights now that we have an additional week of neighborhood-level case data. Read More
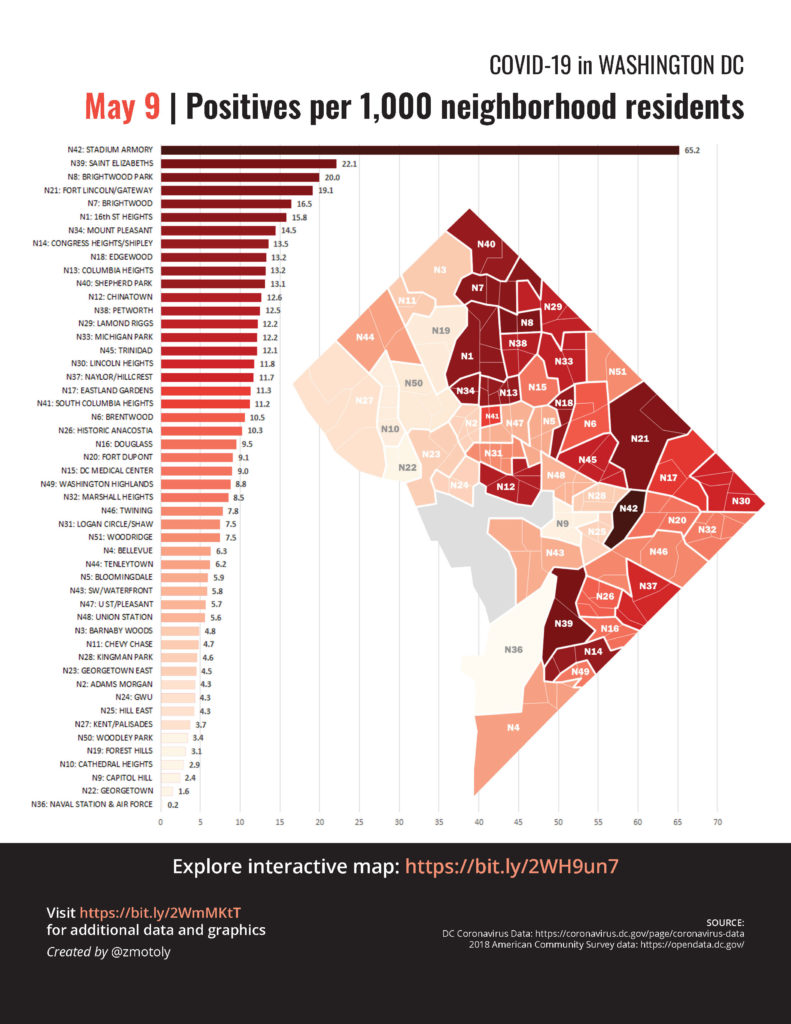
interactive map also embedded below
Huge thanks to Molly for sharing some perspective on the District’s neighborhoods coronavirus map:
“I’m following up about providing some more details and explanation about my DC COVID map that’s weighted by population. There had been some discussion about wanting to see a version of the map that controlled for population in the comments on your daily data posts this week, and I was really curious so I spent some hours correlating the census tract data against the ‘neighborhood’ COVID map that the city started publishing earlier this week. I would say I’m semi-professional when it comes to things like this–as in, I have professional training but it’s not what I usually get paid to do these days. So I’d call this a citizen data science effort!
The city has been reporting coronavirus data by Ward throughout the crisis. They recently added a report for positive cases by “neighborhood”. The city’s neighborhoods are made up of groupings of DC census tracts (standardized geographic areas) so may not align with what we commonly consider neighborhood boundaries. If you want to look at the city’s neighborhood classifications more closely, zoom in on this pdf map.
The city reports the total number of positive cases per neighborhood in their daily reports. However, some neighborhoods have a much higher population than others. If 200 people are sick, it’s important to know whether it’s 200 out of 2,000, vs. 200 out of 20,000. To provide this perspective, I created a map graphic that can show us the rate of cases in each neighborhood, with an interactive map here:
This way isn’t necessarily “better” than the city’s way of showing it, but I personally find it helpful to understand the extent of the outbreak relative to population. Read More
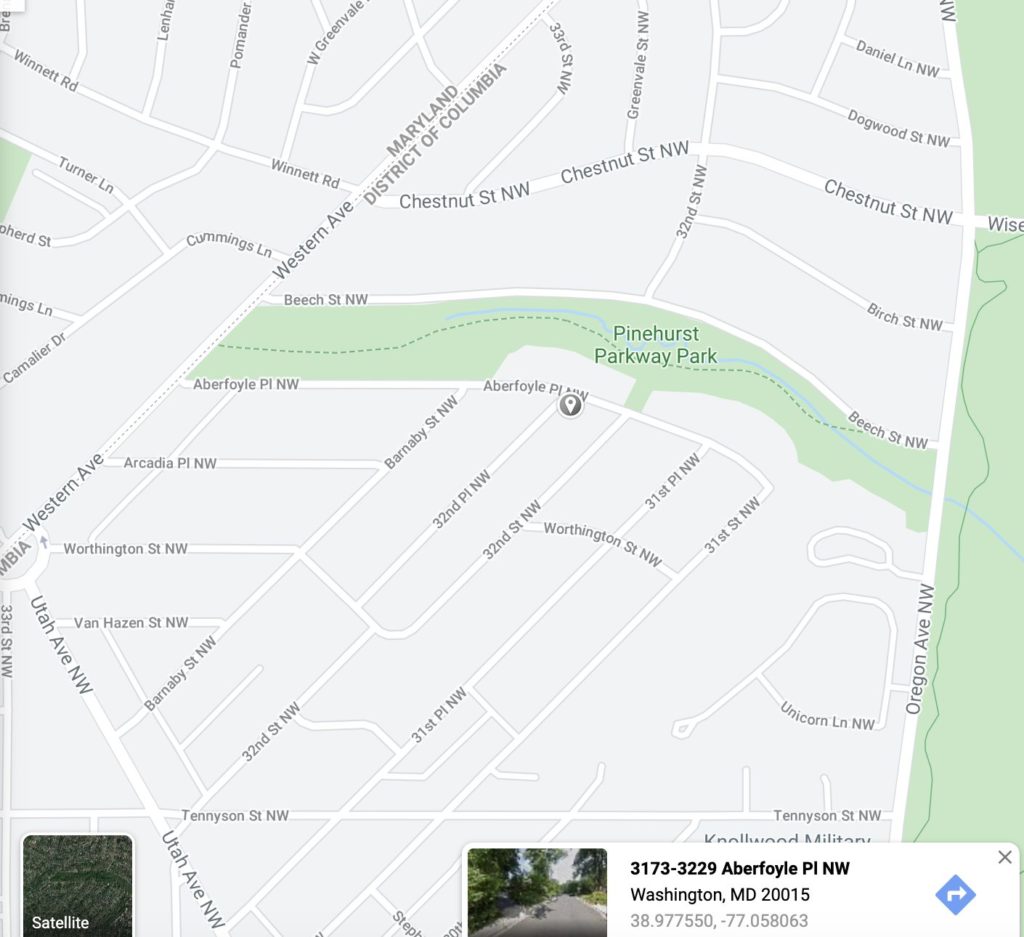
“Dear PoPville,
I stumbled on this little gem today – Google maps shows all addresses in the Barnaby Woods neighborhood as being in “Washington, MD!” I have no idea how to report this. see attached screenshot [in the lower right hand corner.]”
“Dear PoPville,
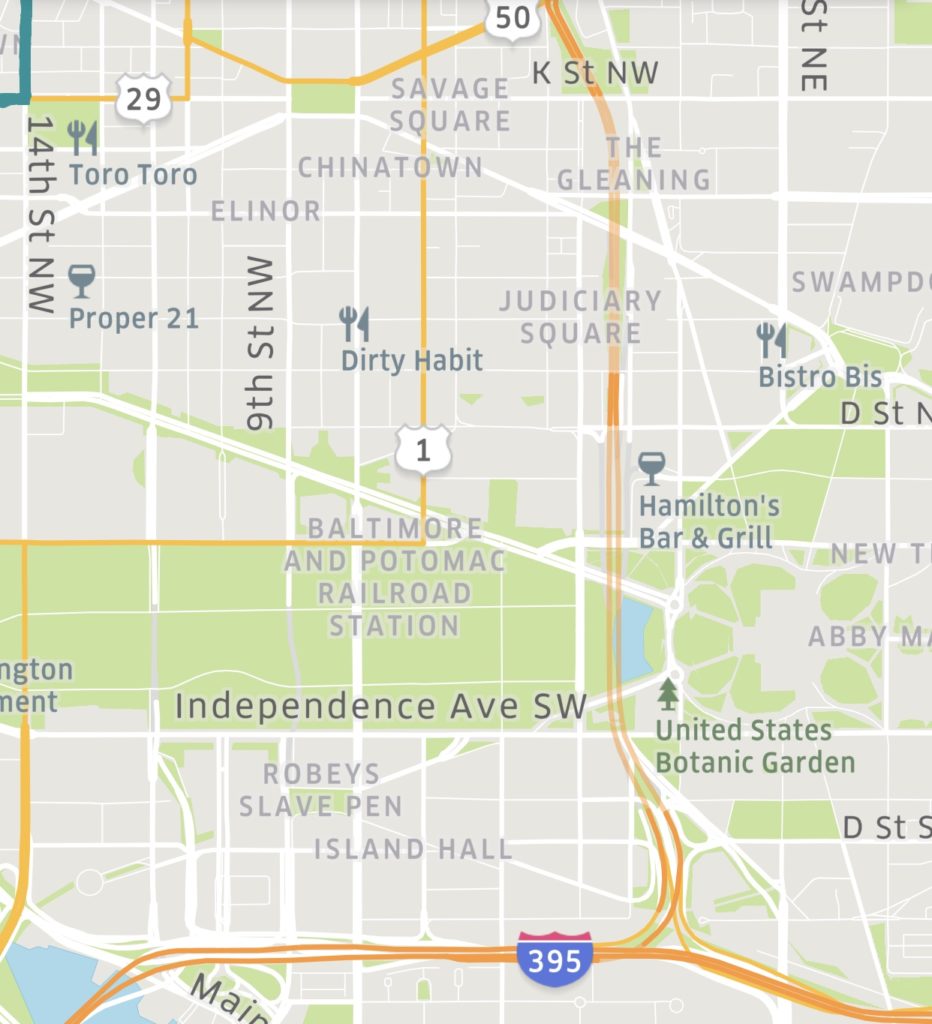
My partner shared their ride home with me on Uber last night. My app wasn’t working, but I was able to follow it through my phone’s web browser. The map of DC that appeared when I opened it mentions quite a few neighborhoods that I’ve never heard of…from my very small amount of research, it looks like some of these names date all the way back to the 1800s. Read More
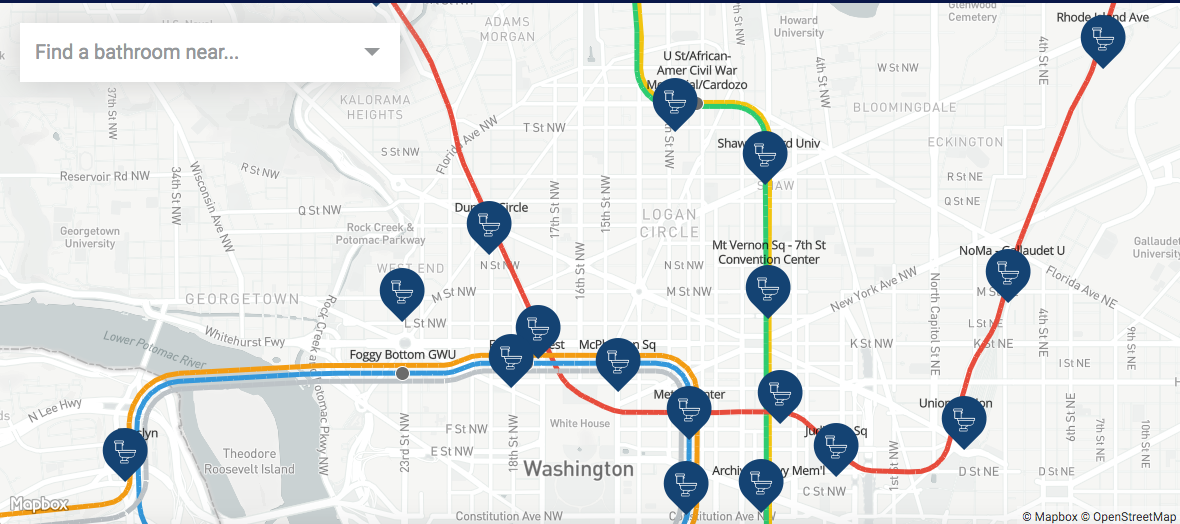
click here for interactive map by Michael & Sons.
“Dear PoPville,
If you’ve been stuck on the metro during SafeTrack longer than anticipated, you know what it’s like to hold your bladder during transit. No one should have to suffer through that!
Introducing… A Guide to DC Metro Restrooms
The team at Michael and Son put together this enormously detailed map depicting the closest free restroom to each station in the DC metro system.” Read More

