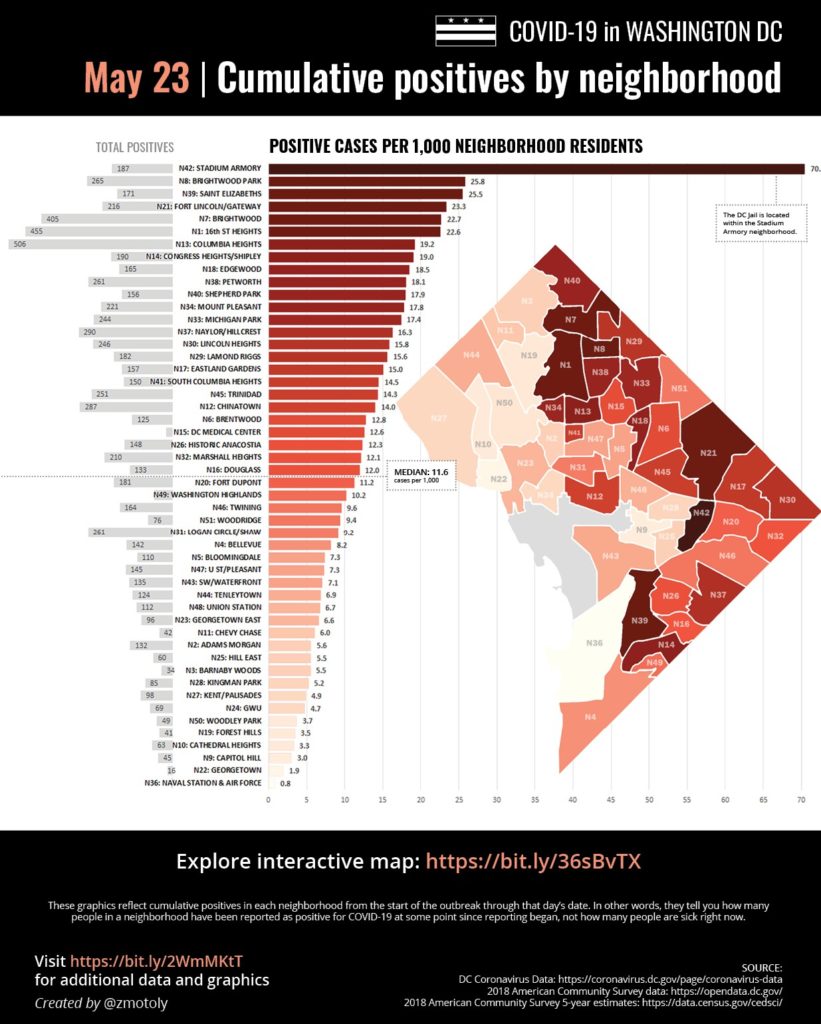
Ed. Note: Molly lives in Petworth. Molly is a hero for doing this. Huge thanks to Molly Tolzmann. Truly. You can explore the interactive map below.
State of the neighborhoods: This week’s big picture has not changed substantially. We see the same 5 neighborhoods as last week at each end of the spectrum, for most and fewest cases per 1,000 residents. A reminder that more data and maps are available here.
Notable this week: We got several days of neighborhood-level testing data from the city for the first time. Whether they will continue to report this (and whether they’re making other changes to the way they report testing) remains to be seen, but the few days they did give us make for an interesting snapshot in time.
Here’s a chart showing the per capita testing rates by neighborhood as of May 21, the last date for which testing data was provided. This chart shows both the cumulative number of tests per 1,000 neighborhood residents, as well as the rate of positives.
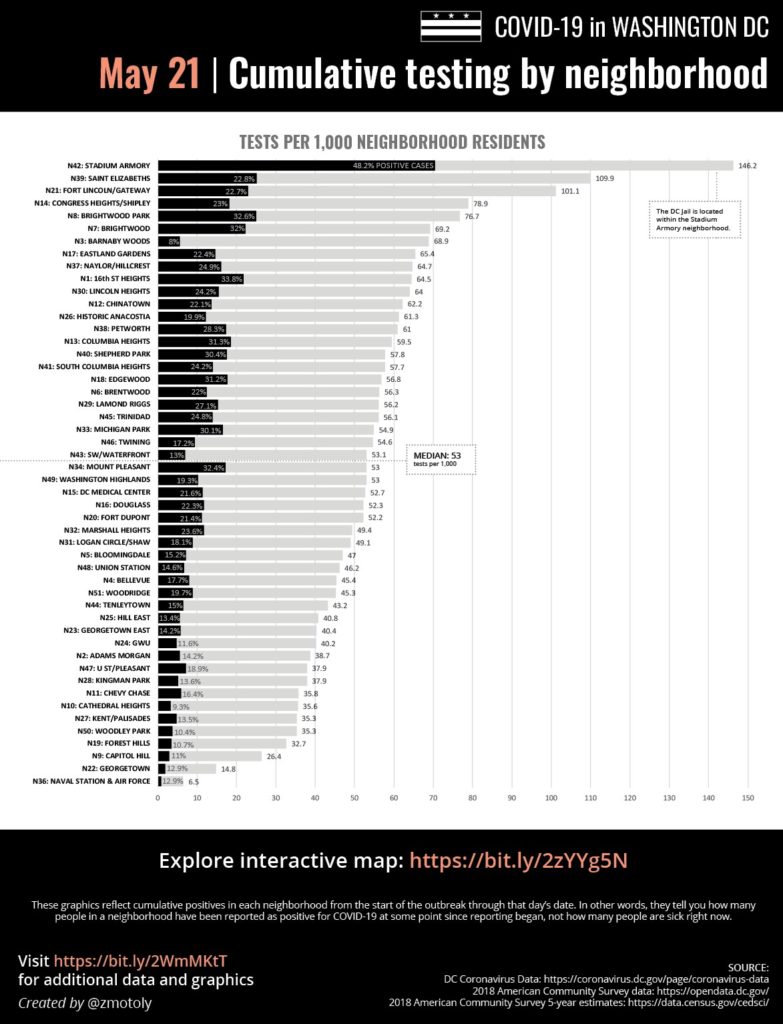
Generally speaking, neighborhoods that have seen higher rates of testing have also seen a higher proportion of positive cases: Neighborhoods below the median for test rates (meaning 53 or fewer tests per 1,000) had a May 21 median positive rate of 14.8% and 6.2 cases per 1,000. Neighborhoods with more than 53 tests per 1,000 had a median positive rate of 24.5% and 16.3 cases per 1,000.
Now that we have seen some testing data, it’s clearer that the differences in case rates between neighborhoods are not simply due to the quantity of testing. For example, the higher positives rate in Brightwood (22.2 per 1,000 on May 21) vs. Bloomingdale (7.1 per 1,000) isn’t simply because more people have been tested in Brightwood. More than twice the proportion of Brightwood tests have been positive compared to Bloomingdale’s. If we get more testing data over time, we can monitor how and how fast the rate of testing is changing in each neighborhood and how this relates to the number of cases.
The 10 neighborhoods that saw the biggest weekly increase in positive rate are more concentrated in DC’s north-central corridor than they were last week. For reference I also included the as-of May 21 testing data for the two pools in the chart below.
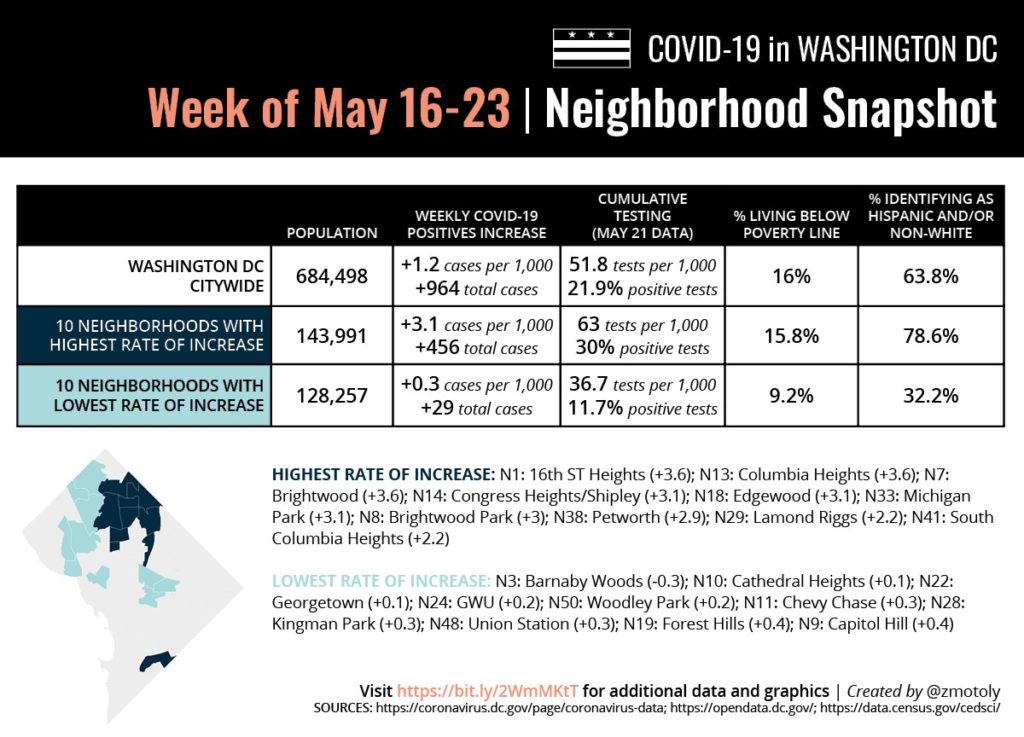
We still have a stark disparity in profiles between the pools of neighborhoods where the case rate is changing the most and least, if slightly less of a disparity than last week. As the conversations around reopening grow louder from all sides, I would bet that attitudes are shaped in part by what the pandemic has looked and felt like in each of our own immediate neighborhoods. The data continues to reveal that we have had very different experiences.
Recent Stories

Photo by Aimee Custis Ed. Note: If this was you, please email [email protected] so I can put you in touch with OP. “Dear PoPville, Mission on Saturday night (04/13) in…

Unlike our competitors, Well-Paid Maids doesn’t clean your home with harsh chemicals. Instead, we handpick cleaning products rated “safest” by the Environmental Working Group, the leading rating organization regarding product safety.
The reason is threefold.
First, using safe cleaning products ensures toxic chemicals won’t leak into waterways or harm wildlife if disposed of improperly.

Looking for something campy, ridiculous and totally fun!? Then pitch your tents and grab your pokers and come to DC’s ONLY Drag Brunch Bingo hosted by Tara Hoot at Whitlow’s! Tickets are only $10 and you can add bottomless drinks and tasty entrees. This month we’re featuring performances by the amazing Venus Valhalla and Mari Con Carne!
Get your tickets and come celebrate the fact that the rapture didn’t happen during the eclipse, darlings! We can’t wait to see you on Sunday, April 21 at 12:30!
Cinco de Mayo Weekend @ Bryant Street Market
SAVE THE DATE for Northeast DC’s favorite Cinco de Mayo celebration at Bryant Street NE and Bryant Street Market!
Cinco de Mayo Weekend Line up:
Friday, May 3:
Alt Comedy Show – Zack White – Milky Way
DC’s most annoying comedian is moving to Brooklyn- come say good riddance April 20th at Slash Run with a special half hour show and taping. Featuring standup, powerpoint presentations, and dumb prop stuff, Milky Way is a send-off to two


