Ed. Note: Molly lives in Petworth. Molly is a hero for doing this. Huge thanks to Molly Tolzmann. Truly. You can explore the interactive map below.
I appreciate all of the comments and exchange sparked by last week’s look into DC’s per-capita COVID situation. Someone called me a ‘citizen analyst’ and I feel honored to hold that title, at least temporarily. So your citizen analyst is back with a few more insights now that we have an additional week of neighborhood-level case data.
As a reminder, you can find additional graphics, data, and links here.
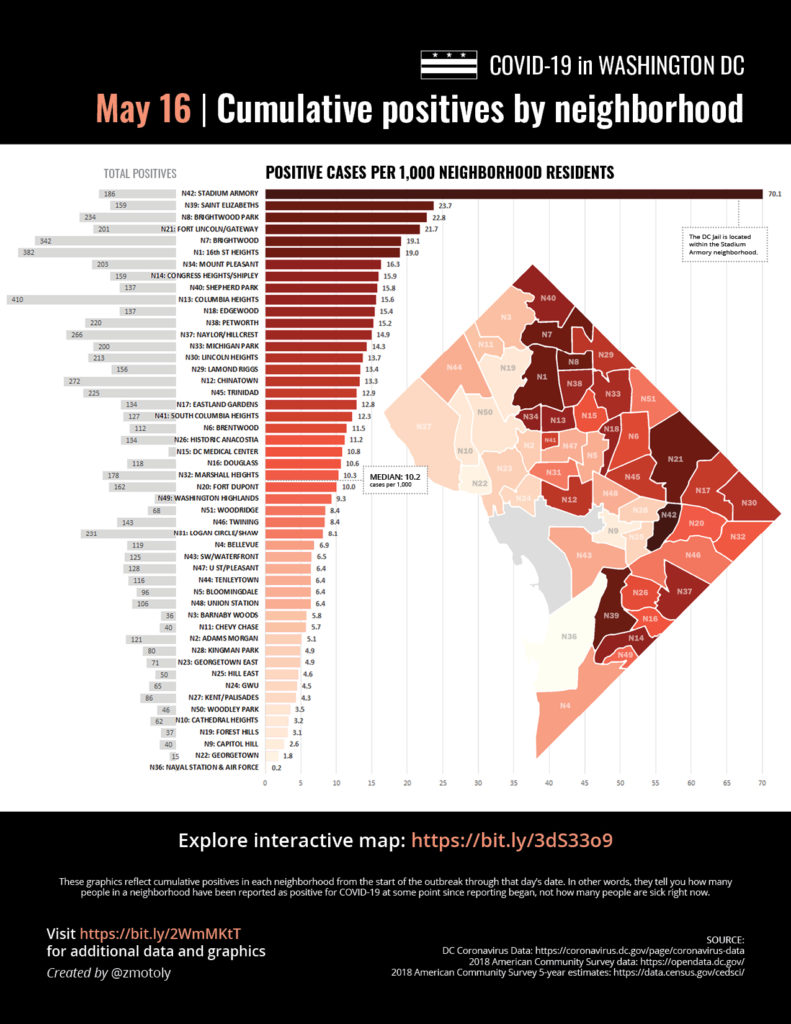
The overall picture looks much as it did a week ago. Citywide, we’re at 10.2 cases per 1,000 people (per May 16 data), up from 8.9 cases per 1,000 on May 9. Note that the numbers reported by the city reflect cumulative positives in each neighborhood from the start of the outbreak through that day’s date. In other words, they tell you the proportion of people who have tested positive at some point in a neighborhood, not how many people are sick right now. Expect to see each neighborhood’s rate increasing over time as more positive cases are reported. It’s the differences between neighborhoods on a given day, as well as the rate of change for each neighborhood, that provide insight into how the outbreak is evolving in different parts of the city.
Stadium Armory (containing the DC Jail) continues to be a major outlier, with a rate nearly three times that of any other neighborhood (70.1 per 1,000) as well as the largest increase in rate this week (+4.9 per 1,000). According to citizen analyst (and maybe real analyst) Jeremy Kittredge who’s been tracking this based on the daily Jail population, the actual rate of DC Jail cases could even be twice as high as my map suggests.
Anyone who has been following the city’s COVID reporting can see that certain areas and communities of DC have been hit harder than others; only 11% of deaths as of May 16 have been non-Hispanic white residents, though non-Hispanic whites make up 36.2% of the city population (per 2018 American Community Survey [ACS] 5-year estimates).
I looked at neighborhood-level demographic information around race/ethnicity, poverty, and other socioeconomic factors. Then I looked at how much the case rate has changed over the past week in every neighborhood. Citywide, the week brought an increase of +1.2 cases per 1,000. The ten neighborhoods with the highest increase came in at +2.8, while the ten lowest came in at +0.2. The overall numbers are small, but that’s still a fourteen-fold difference. And it’s striking to look at the different profile of these two neighborhood pools. The ten neighborhoods where the case rate grew the most this week look very different from the ten neighborhoods where growth was lowest.
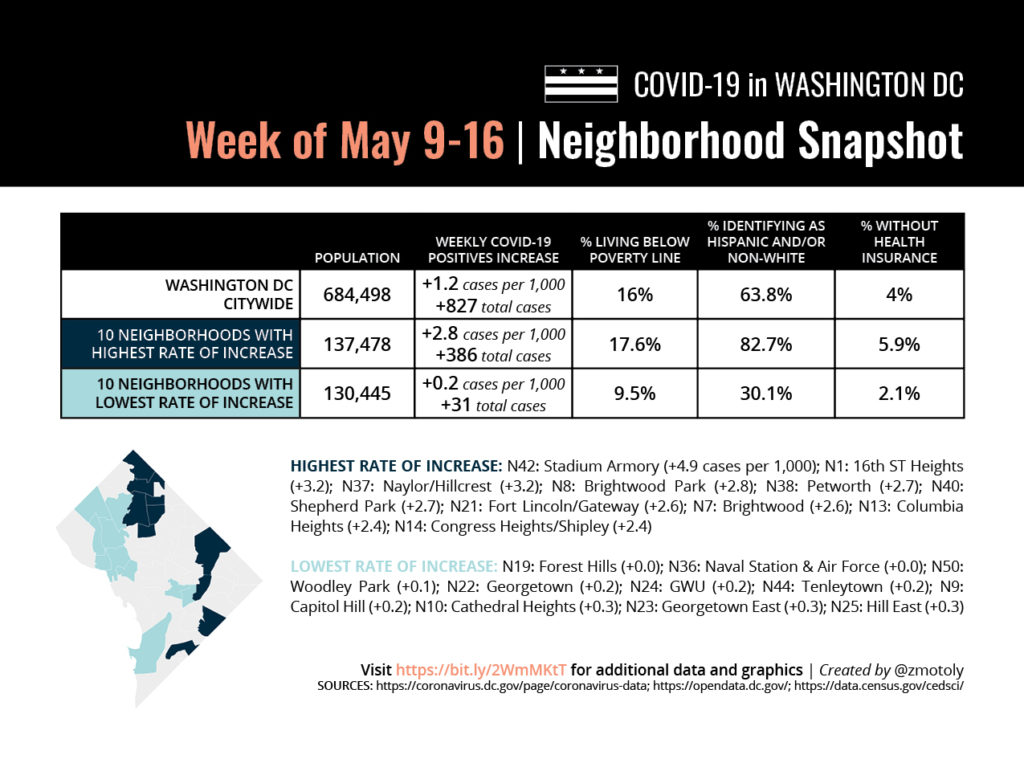
The toll of the virus has not been equal across in our city, marked by racial and socioeconomic divides. This week’s data suggests that these gaps are widening. But this was only one week, so it is important to continue observing these trends over time.
Of course, testing remains an unknown variable in all of this, which a number of commenters pointed out last week. The simplest answer could be that different neighborhoods have seen different rates of testing. We know that, especially in the early days of the outbreak, testing was not available to everyone who wanted it. We also know that there have been presumed positive cases who never received or sought a test and don’t show up in the numbers. Without further information on what testing looks like across neighborhoods, we can’t draw definitive conclusions about the shape of inequities.
Thanks to everyone who has shared additional resources or provided input to help me refine this exercise over the past week, and shoutout to those who are doing their own interesting and useful things with data right now. There are a lot of talented people in this community who care about telling nuanced and accurate DC COVID stories. The city’s own official dashboard has also evolved in the past week, and I like to think this was at least in part motivated by the side efforts of we the people.
Be safe!
Recent Stories

For many remote workers, a messy home is distracting.
You’re getting pulled into meetings, and your unread emails keep ticking up. But you can’t focus because pet hair tumbleweeds keep floating across the floor, your desk has a fine layer of dust and you keep your video off in meetings so no one sees the chaos behind you.
It’s no secret a dirty home is distracting and even adds stress to your life. And who has the energy to clean after work? That’s why it’s smart to enlist the help of professionals, like Well-Paid Maids.

Unlock Peace of Mind for Your Family! Join our FREE Estate Planning Webinar for Parents.
🗓️ Date: April 25, 2024
🕗 Time: 8:00 p.m.
Comedy Cabaret
Kick up your heels at Bad Medicine’s COMEDY CABARET extravaganza at the DC Improv Comedy Club on Tuesday, May 21st. Revel in the sights and sounds of this entertaining musical revue, with songs, dance and sketch comedy that will have
Metropolitan Beer Trail Passport
The Metropolitan Beer Trail free passport links 11 of Washington, DC’s most popular local craft breweries and bars. Starting on April 27 – December 31, 2024, Metropolitan Beer Trail passport holders will earn 100 points when checking in at the


