The following map was made by Sarah Hank. She contributed a crime map of DC here, a sewage and plumbing map of DC here, and a housing values map here.
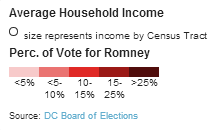
When DC’s population explodes for a days-long of celebration of the 2nd inauguration of Barack Obama this coming weekend, not everyone will be dusting off their screen printed Obama family portrait sweatshirts or marching to the mall via several human funnels with their YES WE DID signs in tow. Even though DC did go 91% for Obama, there are still quite a few who voted for Mr. Romney. In case you were wondering where those people live, I made this highly predictable map of which voting precincts recorded the highest numbers of votes for Romney on election day. The proportional circles (placed at the center of each census tract – not the same as voting precincts) represent average household income based on the 2010 American Community Survey. If you mouse over the circles, you’ll see average income displayed, and if you mouse over the precinct, you’ll see the percentage vote for Romney and Obama (sorry Jill Stein and Gary Johnson).
Recent Stories

Unlike our competitors, Well-Paid Maids doesn’t clean your home with harsh chemicals. Instead, we handpick cleaning products rated “safest” by the Environmental Working Group, the leading rating organization regarding product safety.
The reason is threefold.
First, using safe cleaning products ensures toxic chemicals won’t leak into waterways or harm wildlife if disposed of improperly.

Looking for something campy, ridiculous and totally fun!? Then pitch your tents and grab your pokers and come to DC’s ONLY Drag Brunch Bingo hosted by Tara Hoot at Whitlow’s! Tickets are only $10 and you can add bottomless drinks and tasty entrees. This month we’re featuring performances by the amazing Venus Valhalla and Mari Con Carne!
Get your tickets and come celebrate the fact that the rapture didn’t happen during the eclipse, darlings! We can’t wait to see you on Sunday, April 21 at 12:30!
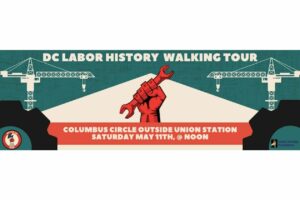
DC Labor History Walking Tour
Come explore DC’s rich labor history with the Metro DC Democratic Socialists of America and the Labor Heritage Foundation. The free DC Labor History Walking Tour tour will visit several landmarks and pay tribute to the past and ongoing struggle
Frank’s Favorites
Come celebrate and bid farewell to Frank Albinder in his final concert as Music Director of the Washington Men’s Camerata featuring a special program of his most cherished pieces for men’s chorus with works by Ron Jeffers, Peter Schickele, Amy


